Despite the continued renewal of the technologies used to perform medical diagnoses, the electrocardiogram (ECG), available since the beginning of the last century, still plays a central role in the investigation of various heart diseases.
The ECG is an important complementary exam for the interpretation of the heart rhythm and for the detection of heart ischemia. The electrocardiogram is also of great value in evaluating other types of cardiac abnormalities, including cardiac valve diseases, cardiomyopathy, pericarditis, and cardiac sequelae of hypertension.
In this text we will try to explain the ECG for the lay population. Our goal, of course, is not to teach anyone to interpret an electrocardiogram, or exhaust the subject, even because it is too complex to be addressed in a single text.
The electrocardiogram is an examination that detects the electrical activity of our heart. We can say that our heart is an organ driven by electricity. Each beat, each contraction of the heart muscle, each movement of the heart valves are commanded by small electrical impulses generated in the heart itself (I will explain more details sooner).
Thanks to the ECG we were able to identify the normal patterns of transmission and generation of these electrical impulses. Anomalies in cardiac electrical activity are clear signs that there are problems with our heart.
The electrocardiogram is a more appropriate test to evaluate cardiac arrhythmias and for the initial investigation of cardiac ischemias.
Is the electrocardiogram to treat any disease?
No! The ECG is just an exam. It treats no illness or symptom. In the same way that a patient with pneumonia does not improve when taking a chest x-ray, the patient with heart problems does not suffer any alterations when taking the electrocardiogram.
The resting electrocardiogram is done with the patient lying down and with the bare trunk. Ideally, the patient has not made any effort in the last 10 minutes or smoked in the last 30 minutes prior to the test.
Six electrodes are attached via adhesive to the chest and 4 more pads, also with electrodes, are placed on the wrists and ankles, as shown in the illustration. Usually, a little gel is used between each electrode and the skin to increase electrical conduction.
In some cases, the 6 stickers with electrodes attached to the chest are replaced by rubber pears with a metal base, which attaches to the skin through a vacuum, such as suction cups.
After the correct placement of the electrodes in the patient, they are connected to the machine that will read the electrical activity of the heart.
Do not be alarmed, there is no risk of you getting a shock during the exam. The electrocardiogram presents no health risk; the worst that can happen is you have a mild allergy at the site of the stickers.
If the patient has many chest hairs, it may need to be scraped before the electrodes can be fixed.
The exam is very fast. After all, the result comes out in a matter of seconds. The machine picks up the electrical signals from the heart and prints a stroke on its own checkered paper.
To understand the results of the electrocardiogram a little, we need to know how to generate and propagate the electrical impulses in the heart. The explanation below may seem confusing, but it is important to understand concepts such as "sinus rhythm", "changes in ventricular repolarization", "branch block", often reported in ECG reports.
The electrical stimulus is born in the heart itself, in a region called the sinus node (or sinus node), located at the apex in the right atrium. The sinus node continuously and regularly produces electrical impulses that propagate throughout the heart, inducing the contraction of the heart muscles. Therefore, a heart in sinus rhythm is one whose electrical stimuli are normally being generated by the sinus node.
The electrical impulses as they spread throughout the heart muscle induce the entry of calcium ions into the heart cells, a process called electrical depolarization. Depolarization stimulates muscle contraction. After contraction, large amounts of the potassium ion leave the cells, in a process called repolarization, which prepares the muscle cells for further depolarization. As long as there is no repolarization, the muscle cell can not contract again, even though it receives electrical stimuli.
See the animation above. The normal electrical activity is born in the sinus node, depolarizes first the right atrium and then the left atrium. After passing through the two atria, the electrical impulse reaches the atrioventricular node, in the division between the atria and the ventricle. At this moment, the impulse undergoes a small delay, which serves for the atria to contract before the ventricles. At the atrioventricular node, after a few milliseconds of waiting, the electrical impulse is transmitted to the two ventricles, causing their cells to depolarize, causing cardiac contraction and pumping of blood through the heart. The electric impulse takes 0.19 seconds to travel through the entire heart.
Let's talk only about the basics, trying to address what else appears in the reports of the electrocardiograms.
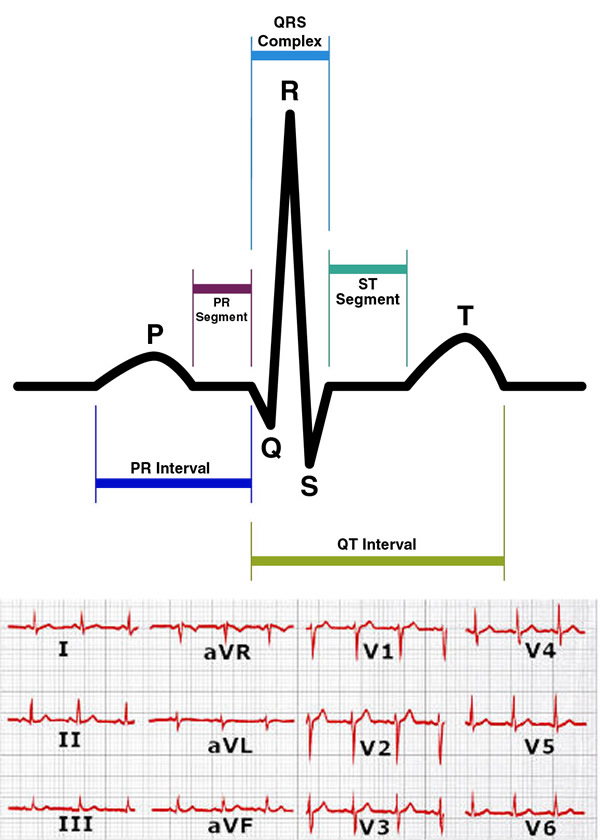
Follow the figure to the side. The electrocardiogram is basically composed of 5 elements: P wave, PR interval, QRS complex, ST segment and T wave. Namely:
The P wave is the stroke that corresponds to the depolarization of the atria (contraction of the atria).
The PR interval is the time between the onset of depolarization of the atria and the ventricles.
The QRS complex is depolarization of the ventricles (contraction of the ventricles).
The ST segment is the time between the end of the depolarization and the beginning of repolarization of the ventricles.
The T wave is the repolarization of the ventricles, which become fit for further contraction.
Each heart beat consists of a P wave, a QRS complex, and a T wave.
Note: Atrial repolarization occurs at the same time as depolarization of the ventricles, so it does not appear on the ECG, and is covered by the QRS complex.
Note 2: The QRS complex may have several appearances, depending on the derivation in which it is visualized.
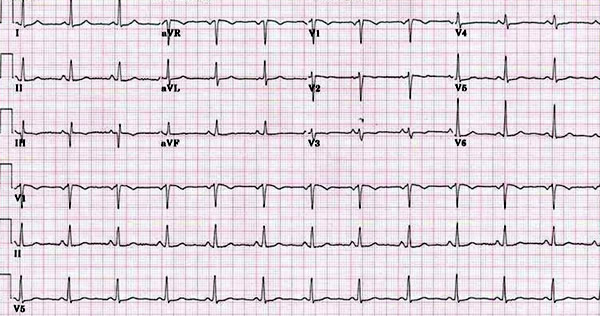
All this path of electric impulse is captured and interpreted by the electrocardiogram through strokes. The various positions of the electrodes are used to capture different angles of the heart, as if they were several cameras facing each part of the organ.
The usual ECG has 12 leads, which are like 12 different angles that accompany simultaneously the propagation of electrical activity. These 12 leads cover a good part of the heart tissue. They are called: D1, D2, D3, aVR, aVL, aVF, V1, V2, V3, V4, V5 and V6.
Examples: the lower wall of the ventricle can be evaluated by leads D2, D3 and aVF; the anterior wall by V1 to V4 and the high lateral wall by D1 and aVL. Therefore, a change in electrical conduction that is repeated in leads D2, D3 and aVF, for example, indicates some problem in the lower ventricle.
Left bundle branch block (BRE): means that electrical conduction is compromised in the nerve branch that conducts the electrical impulse to the left ventricle.
The left branch bifurcates into the left anterior branch and the left posterior branch. Therefore, if only a part of the branch is compromised, diagnoses of left anterior hemiblock (HBAE) or left posterior hemiblock (HBPE) are also possible.
Right bundle branch block (BRD): means that electrical conduction is compromised in the branch leading the electrical impulse to the right ventricle. The right branch does not branch, so there is only one type of BRD.
Left bundle branch block (BHB) + Right bundle branch block (BRD): This is a situation that means that the transmission of electrical impulses to the ventricle is only done by half of the left branch (only the left posterior branch). This is a patient who is close to losing electrical conduction to the ventricles.
Branches are common in patients with ischemic heart disease. They usually occur in people who have already had a heart attack and/or who have heart failure.
2. Deviation of the electric axis
The normal electric axis varies between -30º and 90º. If the axis is between -30º and -90º, we say that there is a deviation from the axis to the left . The main causes are BRD, left ventricular hypertrophy, pulmonary emphysema, Wolff-Parkinson-White syndrome and previous infarction. Left shift can also occur in healthy people.
If the electric axis is between 90° and 180°, there is a deviation from the axis to the right . The main causes are BRE, previous infarction and hypertrophy of the right ventricle. As with the left shift, the right shift can also occur in people with no heart disease.
3. Sinus arrhythmia
Although the name arrhythmia scare, sinus arrhythmia is a benign condition that often occurs in young people. It is usually a change in heart rate caused by breathing. Because it is sinusal, it indicates that despite the irregular rhythm, the electrical impulse is being generated correctly by the sinus node. It is a change that usually disappears over time.
4. Extrasystoles
Extrasystoles are isolated heart beats out of rhythm. In these cases the heart beats regularly, but suddenly an unexpected isolated beat appears. Extraassystole is called supraventricular if the focus of this anomalous stroke arises somewhere in the atrium (outside the sinus node) and ventricular extrasystoles if the anomalous focus arises somewhere in the ventricle.
Isolated extrasystoles usually have no clinical significance. If they are frequent, they may cause a palpitation sensation. In these cases the cause must be investigated.
5. Changes in ventricular repolarization
Alteration of ventricular repolarization is also a relatively common finding. They are changes in the T wave of the electrocardiogram and may be present in the case of arterial hypertension, aortic valve stenosis or in cardiac ischemia.
However, when the report is described as nonspecific changes in ventricular repolarization, the condition usually has no clinical significance. T wave changes that suggest heart disease have a characteristic appearance that allows them to be distinguished from nonspecific changes without clinical value.
6. Atrial fibrillation
Atrial fibrillation (AF) is a common arrhythmia, especially in the elderly. AF is a non-sinus rhythm, where a chaotic generation of electrical stimuli occurs throughout the atrium, causing it to fail to contract. The court is trembling, as if in convulsion. Since the atrioventricular node exists, these chaotic impulses are aborted before reaching the ventricle. Therefore, the patient does not present a P wave, the heart rhythm is irregular, but the QRS is normal.
7. Left ventricular hypertrophy (LVH)
Also called left ventricular overload, LVH is an increase in left ventricular muscle mass caused by the effort of the heart to pump blood in patients with hypertension.
Left ventricular hypertrophy usually has signs of increased QRS complex amplitude, a T wave alteration, and electrical axis deviation to the left.
The electrocardiogram, because it is inexpensive and easy to access, is the first test performed in patients presenting with complaints of chest pain. There are several findings that may indicate an ischemic disease, including elevation of ST segment (ST elevation), reduction of ST segment (ST depression), inverted T waves or apiculated T waves.
The most classic sign of ECG infarction is ST-segment elevation, called infarction with supra. However, it is important to note that not every heart attack presents with ECG findings. A normal electrocardiogram is not enough to rule out a heart attack! If you have chest pain, and especially if you have risk factors, such as age 50, obesity, diabetes, hypertension, smoking, etc., blood tests (usually troponin titration) should be taken for the best to investigate a possible myocardial infarction.
The electrocardiogram, as well as any complementary diagnostic means, should be regarded as only one piece in the puzzle of a diagnosis. You do not complete a one-piece puzzle. The ECG should be interpreted by a physician who has experience with the examination, always taking into consideration other data, such as medical history, symptoms, physical examination, laboratory tests and other complementary tests.